Sy Harding's Seasonal Timing Strategy (STS)
The other day I came across Sy Harding's website. Until recently I had never heard his name. His website claims that Timer's Digest consistently ranks him as one of the best market timers in a number of different markets. I saw his name mentioned in a mini-article on pg. 58 of the 2001 issue of the Stock Trader's Almanac that I found in the back of our trading library closet. I was looking through it for fun because I initially thought it would be full of superstitions and statistically insignificant claims of the market tending to go up at a particular hour on a specific day of the year. Although the book does contain some questionable claims on specific seasonals, it actually has some very useful information on the history of the stock market.
The mini-article claimed that Sy Harding had improved upon the traditional Sell-in-May-and-Go-Away seasonal market timing by using a daily Moving Average Convergence Divergence (MACD) indicator as confirmation of a short-term rally being under way. I read the page where he explains how he improves the traditional seasonal system. Basically when the seasonal date of October 16th comes around, he checks to see if the MACD is positive (on a buy signal). If it is, you get in October 16th. Otherwise, you wait until the MACD goes positive before buying. For the exit, on April 20th, you check to see if the MACD is on a buy. If it is, you stay in until it goes negative. If it is negative on April 20th, you sell immediately.
Questioning the Claims
I was very suspicious at first because the mini-article in the 2001 Stock Trader's Almanac states:
SEASMACD.EDS (To download, right click and choose "save target/link as").
(Note you need AIQ's Trading Expert Pro and Expert Design Studio to run this file.)
The EDS output didn't give me what I wanted so I used my Excel date converter to shift the dates back one trading day so that I could create a signal file for the ULTRA market timing program I've been using. Then I tested both the S&P500 and DJIA to see if I could at least come close to the returns the Almanac was claiming for the S&P500 and the returns listed on Harding's explanation page for the DJIA.
Results
As I suspected, the article most likely meant to say that Harding's strategy triples the S&P buy-and-hold return, not the November to April seasonal strategy. Although I don't show the results here, Harding's MACD entry strategy only does 1% better in terms of Compound Annual Return (CAR) than does buying November 1st and selling April 30th. However, 1% CAR edge adds up over 50 years.
Below, I replicated the 1950-1999 Harding strategy for the S&P that was listed in the 2001 Almanac:
(Click image to enlarge)

(ULTRA Market Timing was used to run this backtest)
In fact, my backtest shows a slightly higher Compound Annual Return (CAR) than does the table in the Almanac. The Almanac shows a starting account value of $10,000 in 1950, growing to $901,761 by the end of 1999. If you use Excel or a TI-83 calculator to compute the CAR, it comes to 9.41% per year. My backtest shows a CAR of 10.97%. This difference is probably a result of slight differences in the S&P data, the entry and exit dates, and the risk-free rate earned on cash while not invested.
Next I wanted to confirm the claims made in "Table 1" on Sy Harding's page (scroll down till you see Table 1). I was able to corroborate the claims for the 8 years of returns for the DJIA:
(Click image to enlarge)

The left column shows the market returns and drawdowns. The right column shows the Harding strategy results using my approximation of his strategy. The returns almost exactly match his.
If tested on the DJIA over a longer period from 1950 to 2006, the findings are robust:
(Click image to enlarge)

(ULTRA Market Timing was used to run this backtest)
As you can see the Compound Annual Return (CAR) remains high, at 11.29%.
Conclusions
Overall, this seasonal strategy is great (especially IF it continues to work in the future) because you make better than average returns with only being exposed 51% of the time.
Paul
The mini-article claimed that Sy Harding had improved upon the traditional Sell-in-May-and-Go-Away seasonal market timing by using a daily Moving Average Convergence Divergence (MACD) indicator as confirmation of a short-term rally being under way. I read the page where he explains how he improves the traditional seasonal system. Basically when the seasonal date of October 16th comes around, he checks to see if the MACD is positive (on a buy signal). If it is, you get in October 16th. Otherwise, you wait until the MACD goes positive before buying. For the exit, on April 20th, you check to see if the MACD is on a buy. If it is, you stay in until it goes negative. If it is negative on April 20th, you sell immediately.
Questioning the Claims
I was very suspicious at first because the mini-article in the 2001 Stock Trader's Almanac states:
"Applying Harding's signals generated for the Dow, to the S&P, show astounding results. Instead of $10,000 gaining $363,353 over the 50 recent years [1950 to 1999] when invested only during the best six months, the gain almost tripled to $901,761."If I'm not mistaken, the Almanac says that the gains of Harding's slight alteration results in THREE TIMES the ending value than if you only bought November 1st and sold April 30th. What I think they mean is that Harding's strategy triples the S&P buy-and-hold return not the traditional November-April seasonal strategy. I couldn't resist backtesting it myself so yesterday I wrote some AIQ Expert Design Studio (EDS) code to approximate Harding's strategy:
SEASMACD.EDS (To download, right click and choose "save target/link as").
(Note you need AIQ's Trading Expert Pro and Expert Design Studio to run this file.)
The EDS output didn't give me what I wanted so I used my Excel date converter to shift the dates back one trading day so that I could create a signal file for the ULTRA market timing program I've been using. Then I tested both the S&P500 and DJIA to see if I could at least come close to the returns the Almanac was claiming for the S&P500 and the returns listed on Harding's explanation page for the DJIA.
Results
As I suspected, the article most likely meant to say that Harding's strategy triples the S&P buy-and-hold return, not the November to April seasonal strategy. Although I don't show the results here, Harding's MACD entry strategy only does 1% better in terms of Compound Annual Return (CAR) than does buying November 1st and selling April 30th. However, 1% CAR edge adds up over 50 years.
Below, I replicated the 1950-1999 Harding strategy for the S&P that was listed in the 2001 Almanac:
(Click image to enlarge)
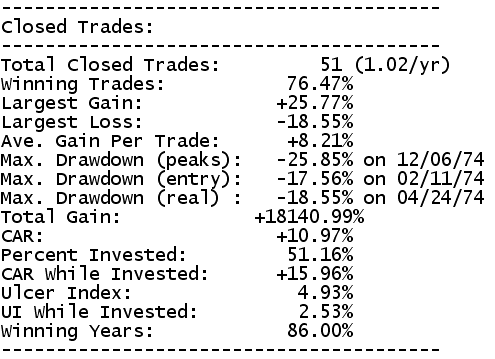
(ULTRA Market Timing was used to run this backtest)
In fact, my backtest shows a slightly higher Compound Annual Return (CAR) than does the table in the Almanac. The Almanac shows a starting account value of $10,000 in 1950, growing to $901,761 by the end of 1999. If you use Excel or a TI-83 calculator to compute the CAR, it comes to 9.41% per year. My backtest shows a CAR of 10.97%. This difference is probably a result of slight differences in the S&P data, the entry and exit dates, and the risk-free rate earned on cash while not invested.
Next I wanted to confirm the claims made in "Table 1" on Sy Harding's page (scroll down till you see Table 1). I was able to corroborate the claims for the 8 years of returns for the DJIA:
(Click image to enlarge)
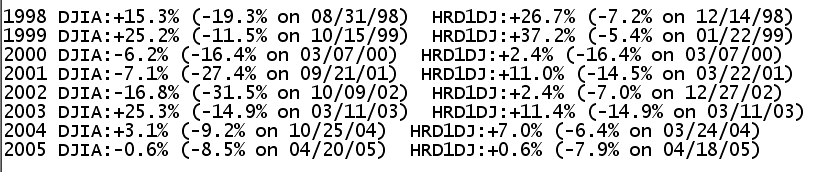
The left column shows the market returns and drawdowns. The right column shows the Harding strategy results using my approximation of his strategy. The returns almost exactly match his.
If tested on the DJIA over a longer period from 1950 to 2006, the findings are robust:
(Click image to enlarge)
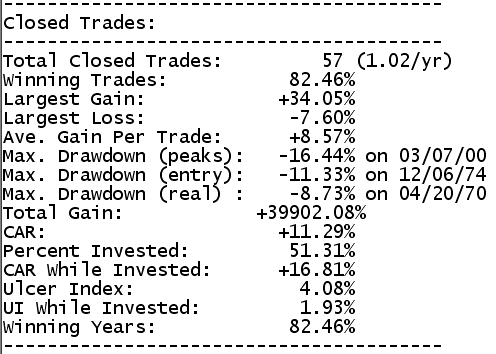
(ULTRA Market Timing was used to run this backtest)
As you can see the Compound Annual Return (CAR) remains high, at 11.29%.
Conclusions
Overall, this seasonal strategy is great (especially IF it continues to work in the future) because you make better than average returns with only being exposed 51% of the time.
Paul
posted by Traders Edge Systems at 4:06 PM
0 comments
![]()
![]()